CAST Imaging
Bring the value of software visualization forward
Getting to the first useful graph
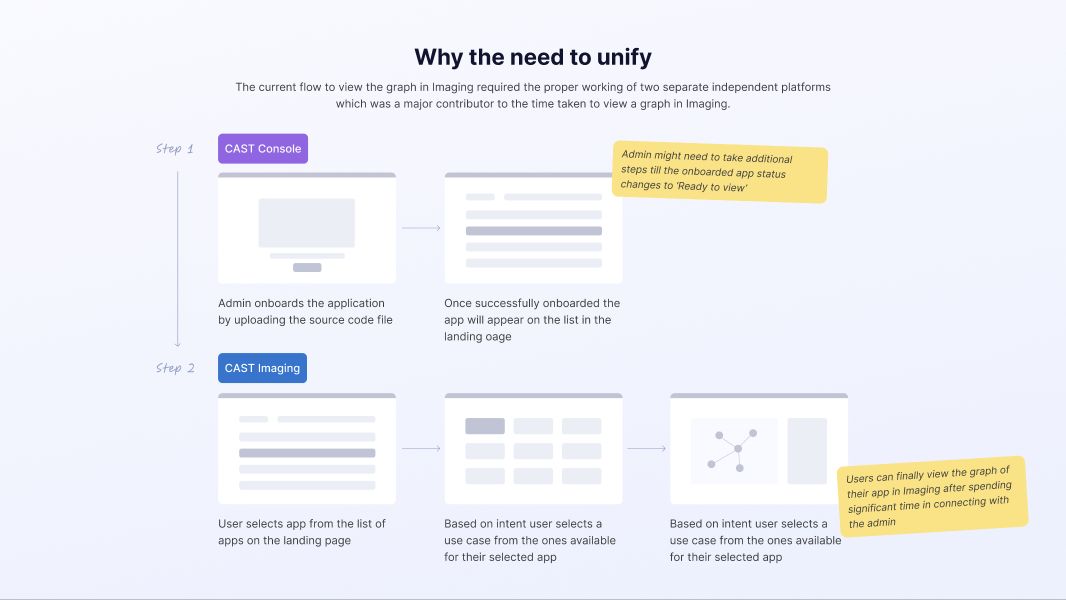
CAST Imaging maps an application’s source code and dependencies. A trial user needed to see what the tool could reveal about their own application. To get there, an administrator first uploaded and onboarded the code in Console. The user then switched to Imaging, found the application, and chose a use case before opening the graph. Any unresolved setup could send the user back to the administrator.
Prioritizing what blocked the trial
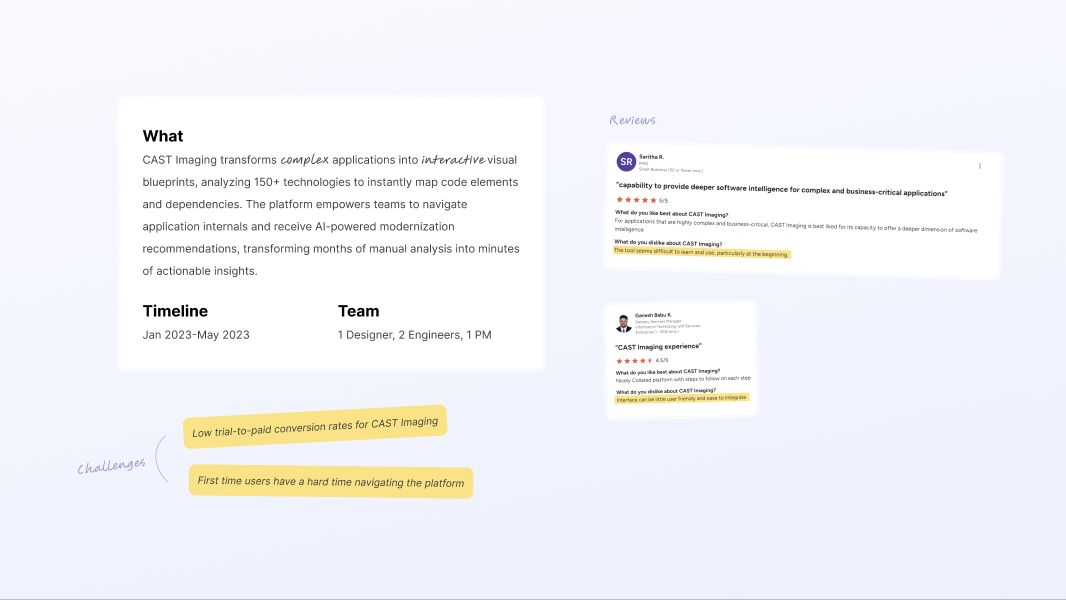
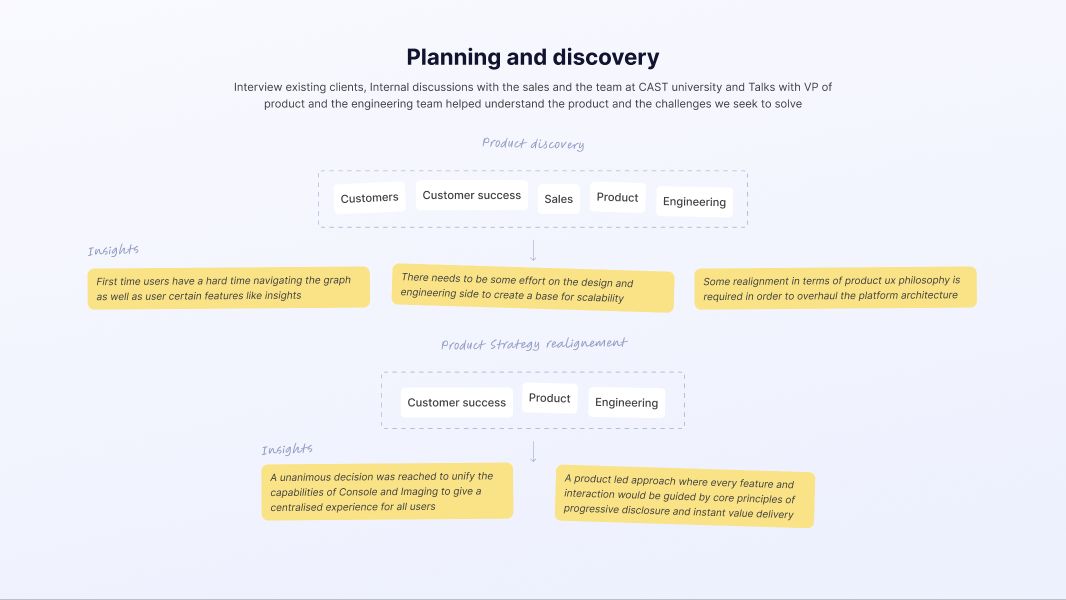
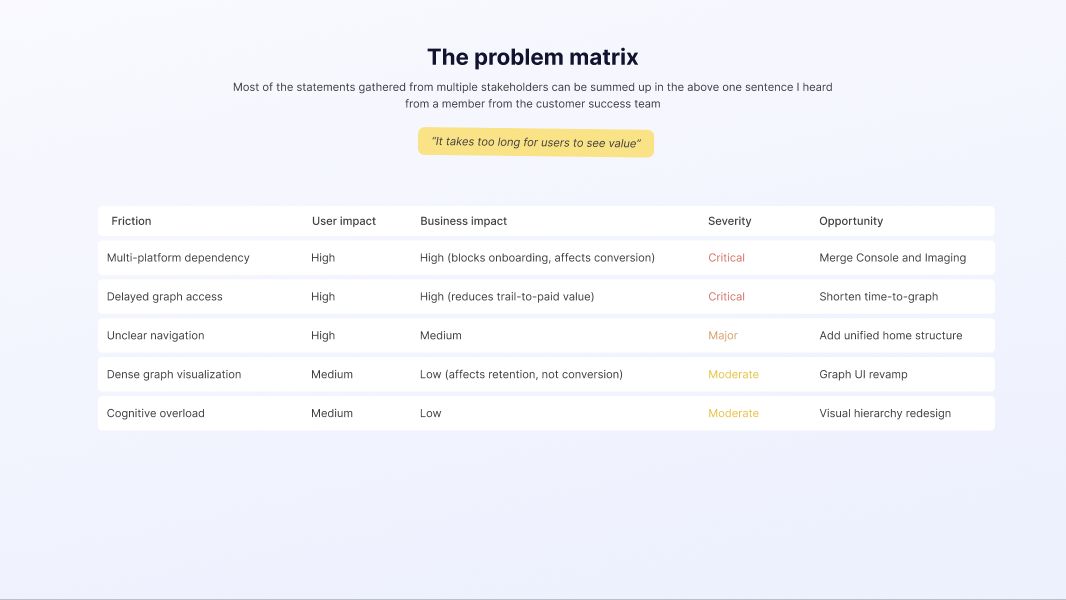
I interviewed existing clients and spoke with sales, customer success, CAST University, product, and engineering. I compared the problems by user impact and business impact. The split between Console and Imaging and the delay before graph access ranked as critical. Unclear navigation followed. Graph density mattered, but simplifying the graph would still leave new users waiting to reach it.
Designing one path from setup to analysis
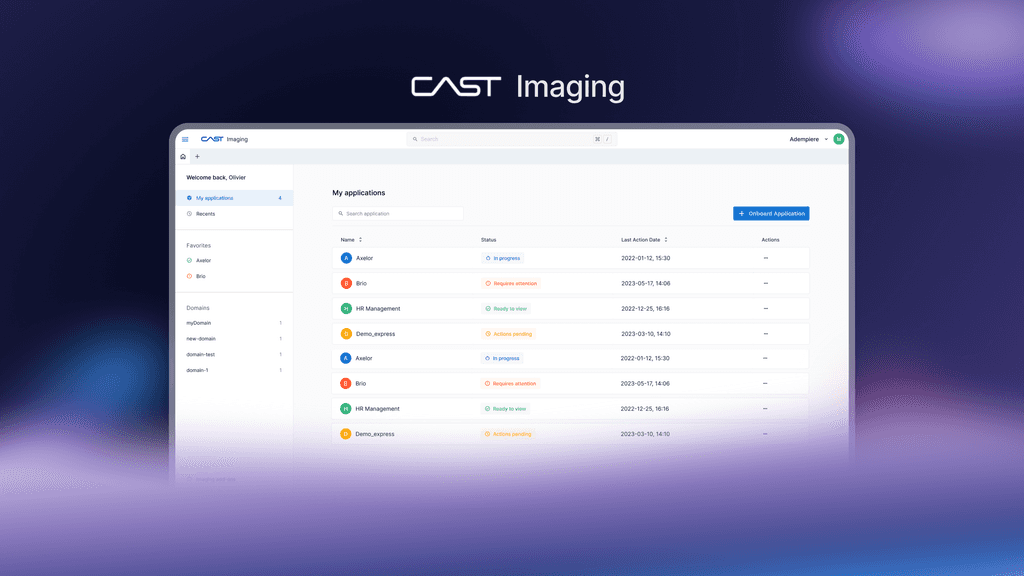
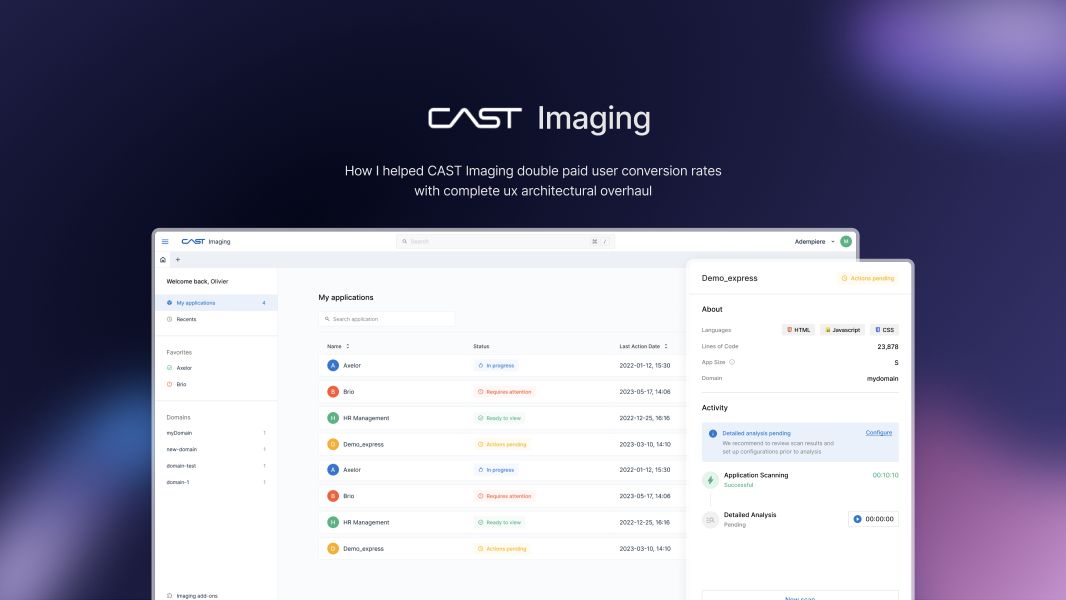
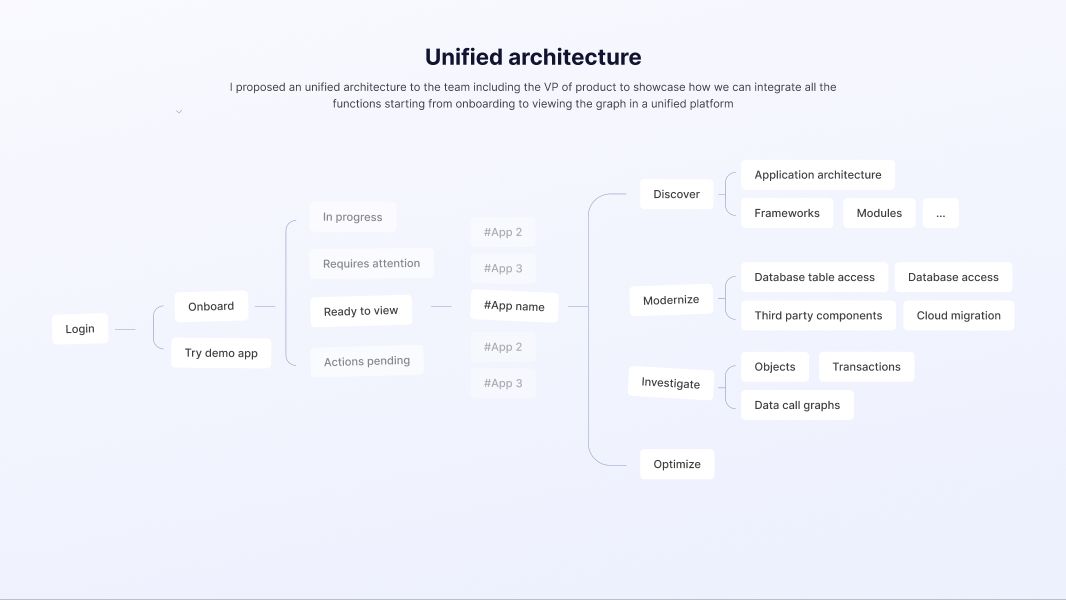
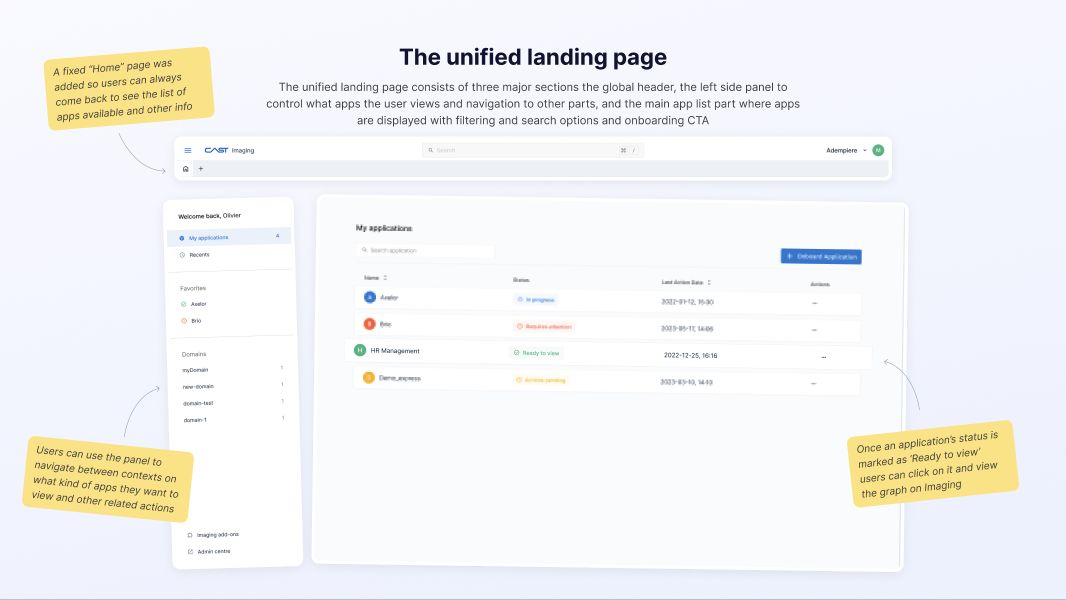
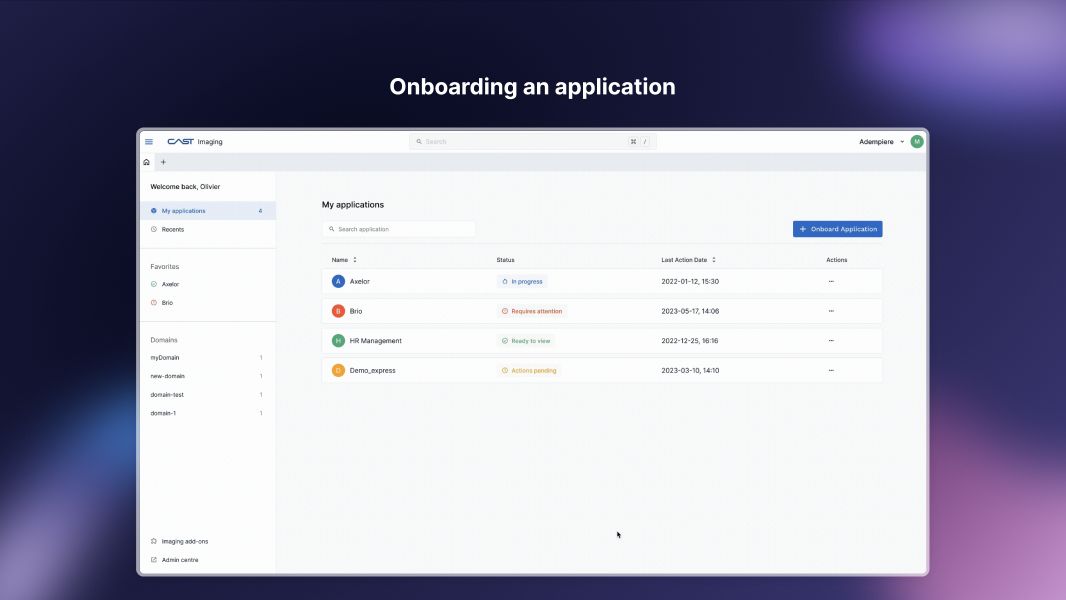
I proposed a unified architecture to the team and VP of Product. From one Home, users could onboard an application or try a demo. A persistent application list showed progress and status, with search, filtering, and access to recent or favorite applications. Once an application was ready, its row opened the graph.
Making unfinished states useful
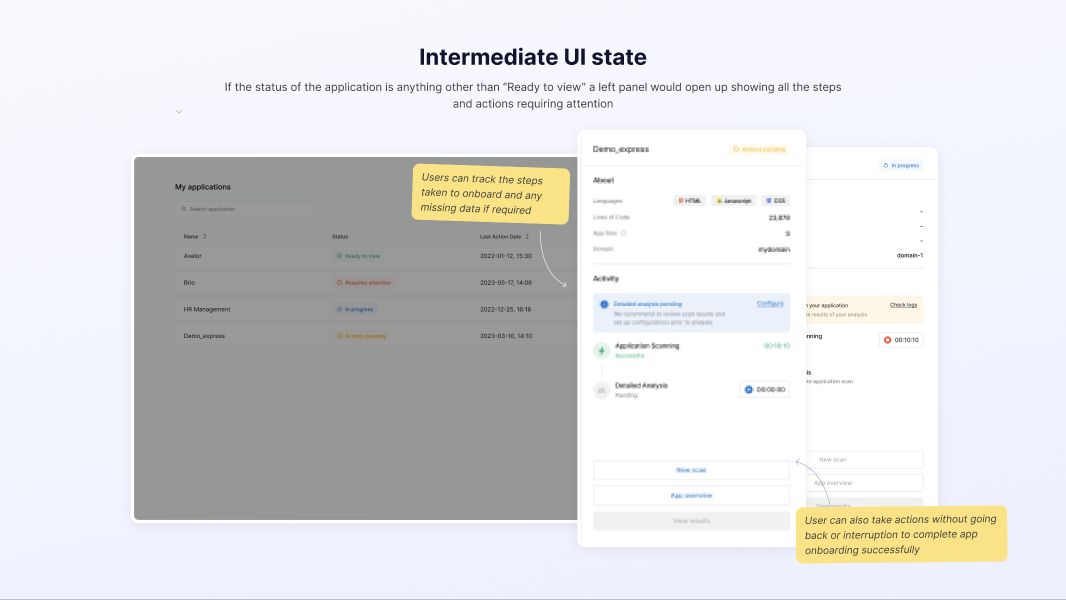
When an application was still processing or needed attention, the row opened a panel with completed steps, missing information, and available actions. A user could address a setup issue without losing their place in the list.
- In progress — see what has completed and what is still running.
- Requires attention or actions pending — see what is missing and act from the application panel.
- Ready to view — open the graph directly from the application list.
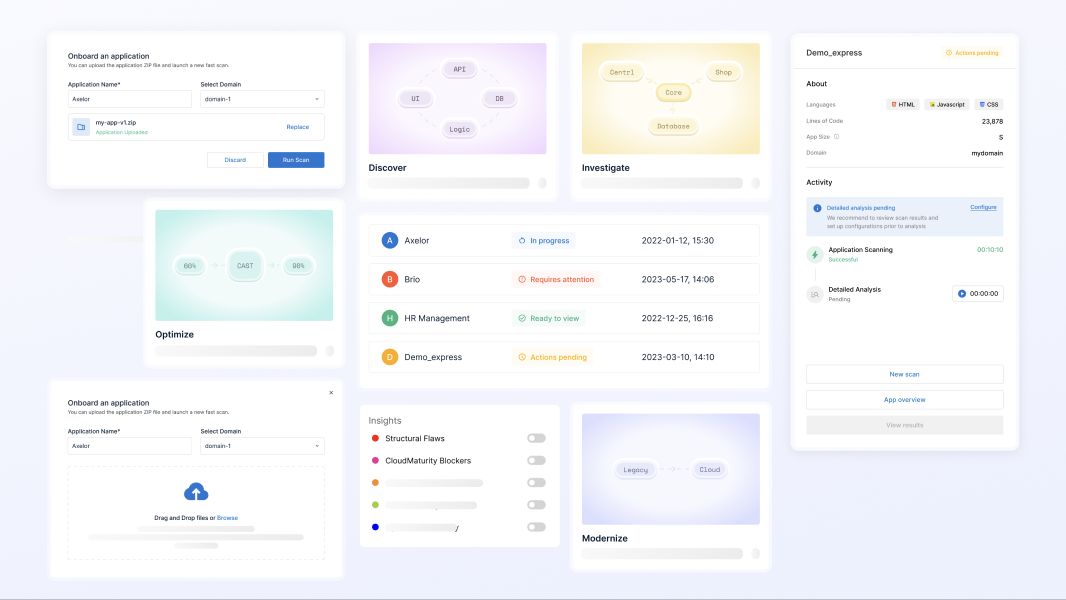
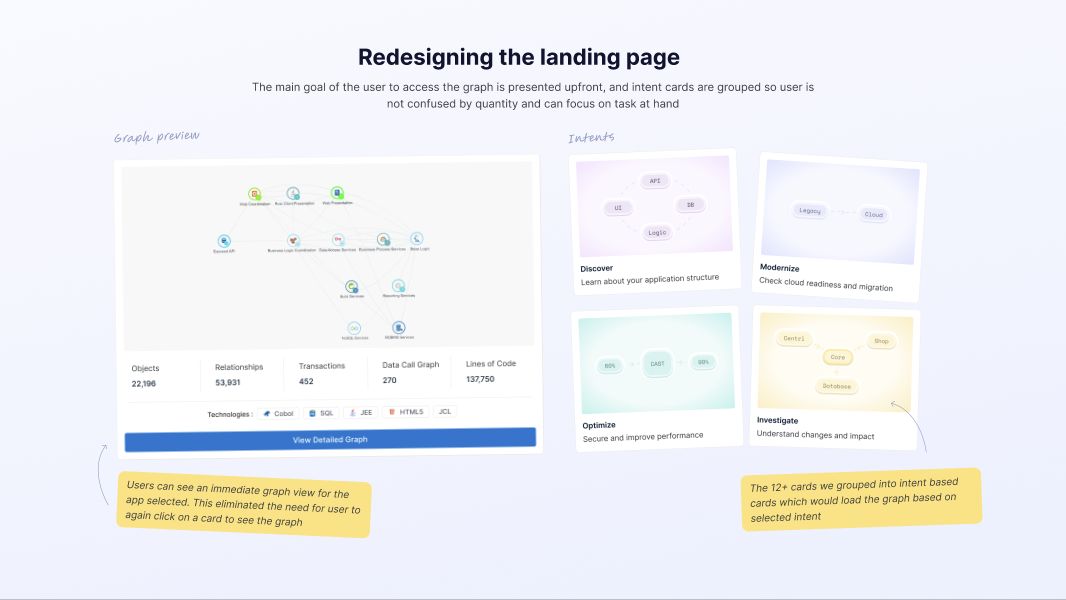
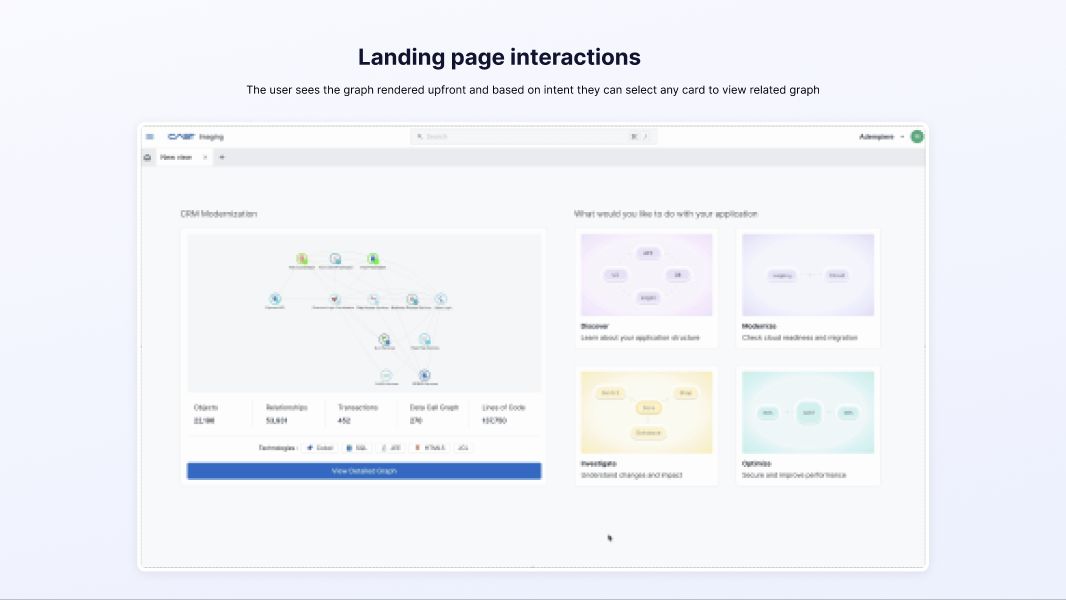
After opening the graph, task groups such as Discover, Modernize, Investigate, and Optimize gave users a starting point while keeping technical detail available.
From landing page to graph
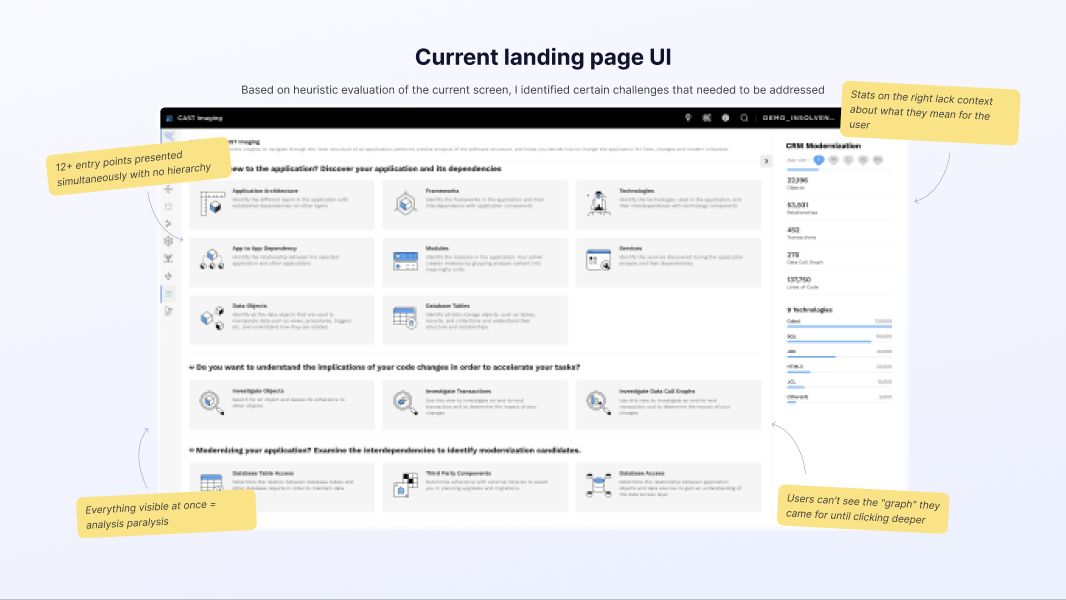
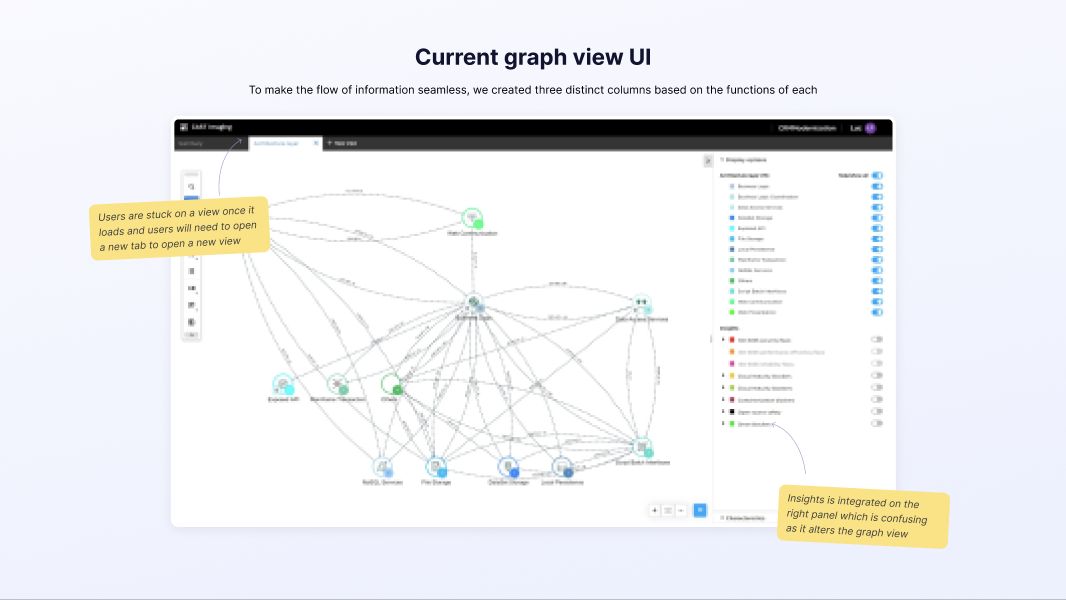
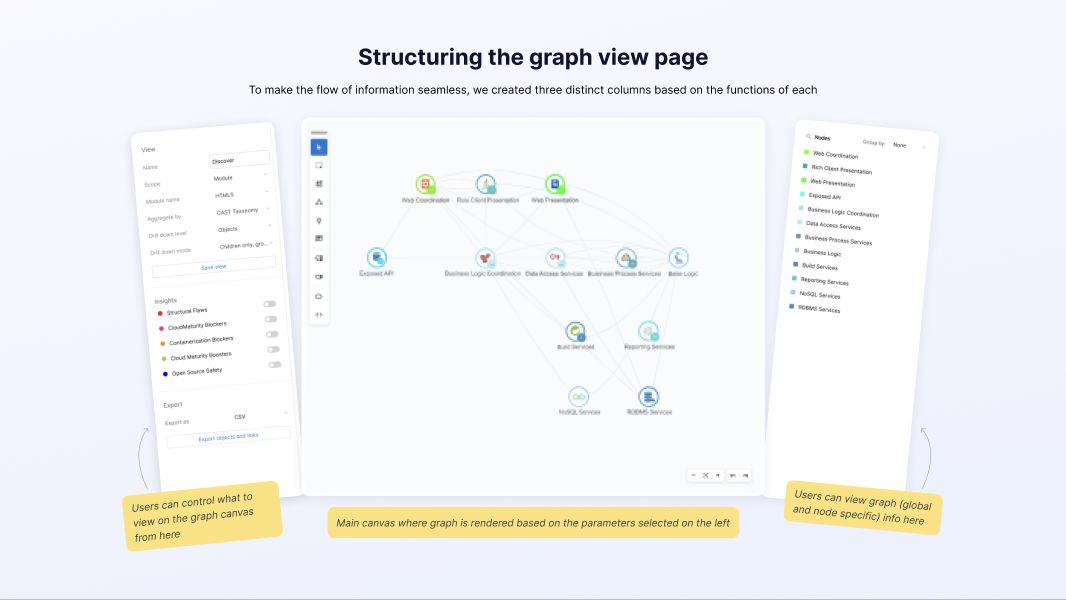
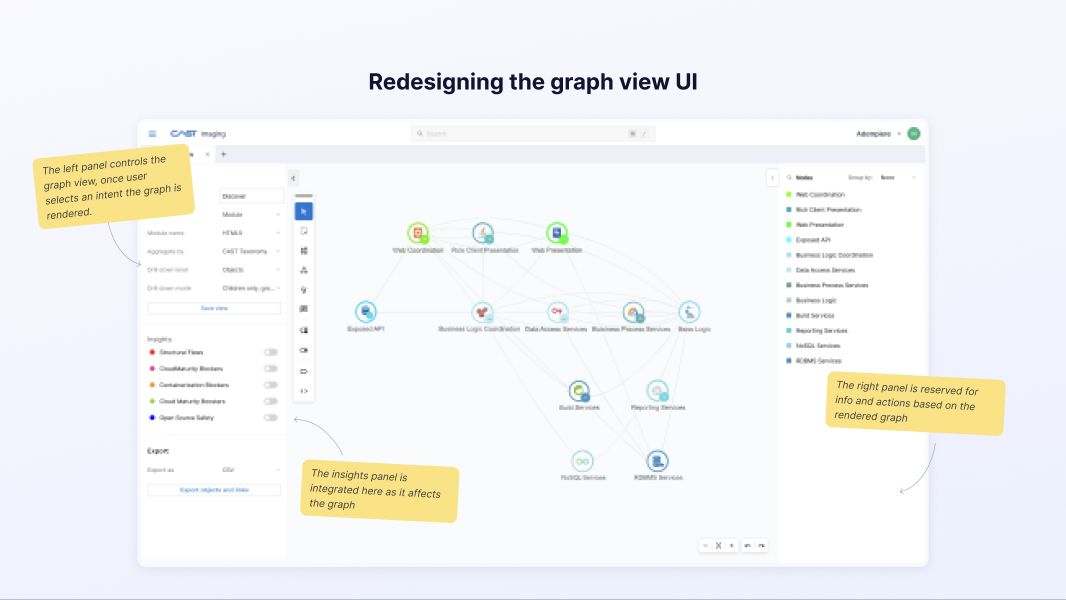
The walkthrough compares the original and redesigned landing pages and graph views. The redesign gives the graph room to work while keeping the surrounding navigation and details available for deeper investigation.
Outcome
My original portfolio reported 2× trial-to-paid conversion after the redesign. The published case does not include the starting conversion rate, cohort size, or measurement window.